Fast, accurate, easy-to-use
.NET performance profiler
Find slow methods, fix deadlocks, and optimize code based on accurate timings with a clear UI.
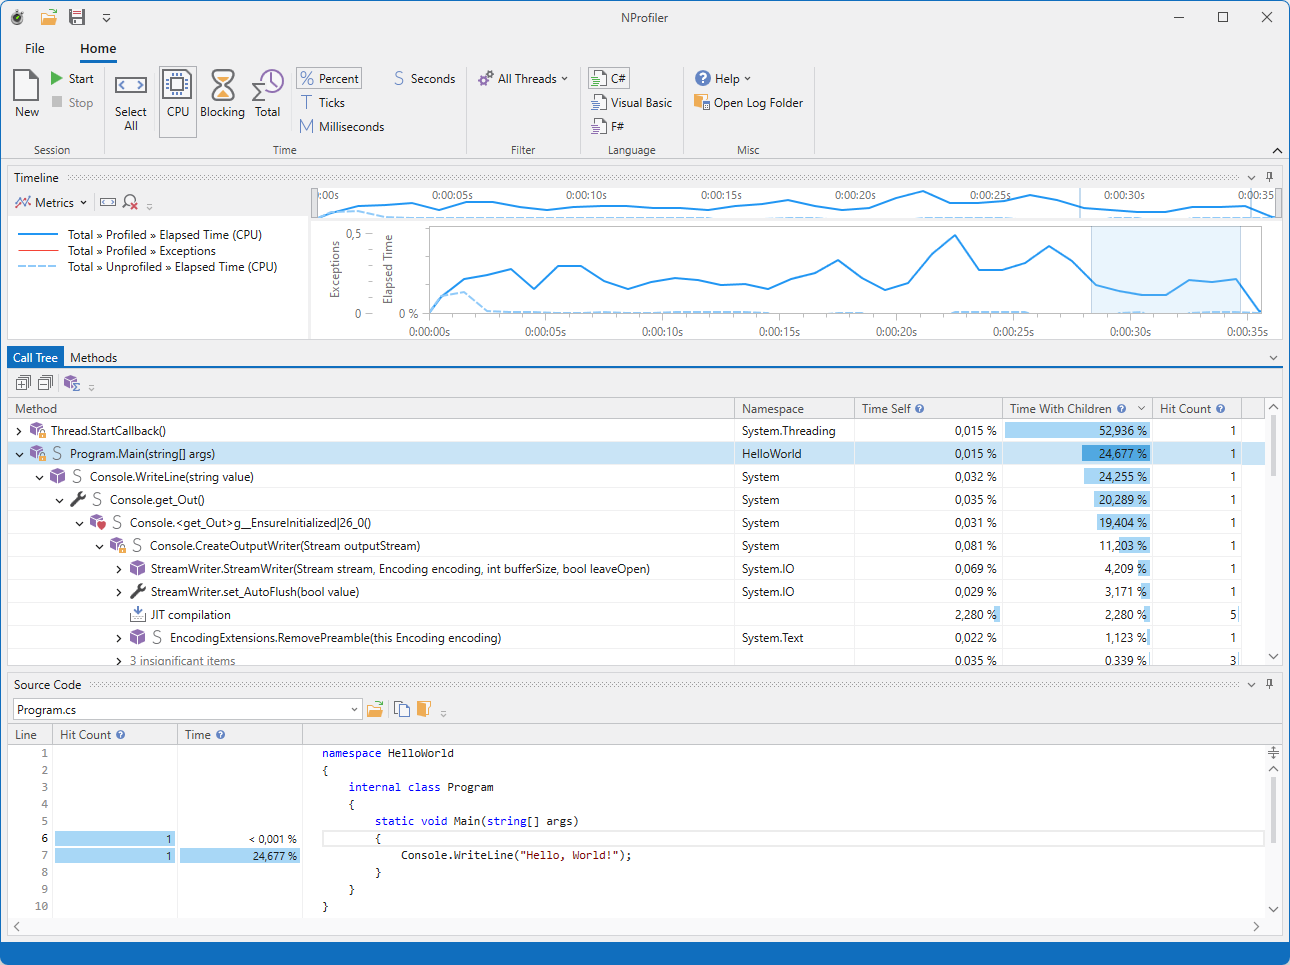
An easy to use profiler delivering rich .NET performance data
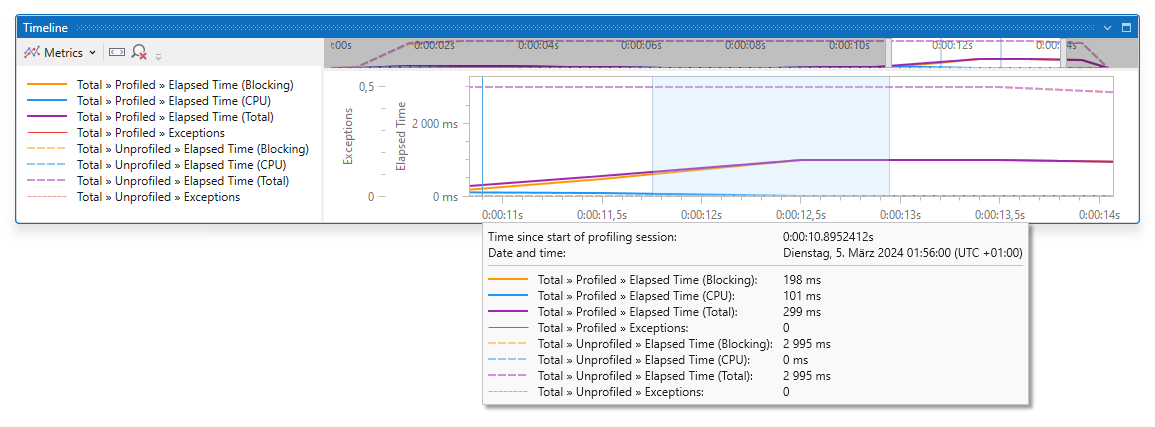
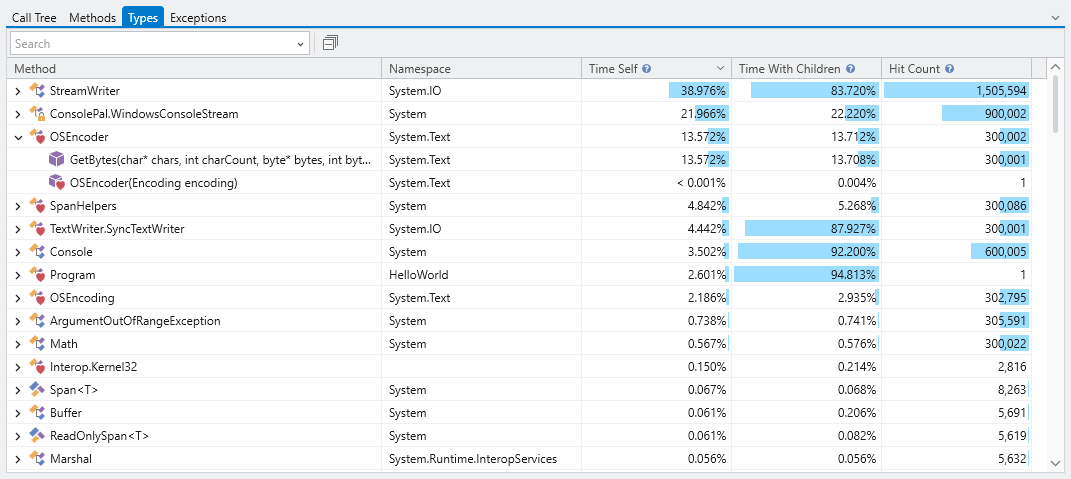
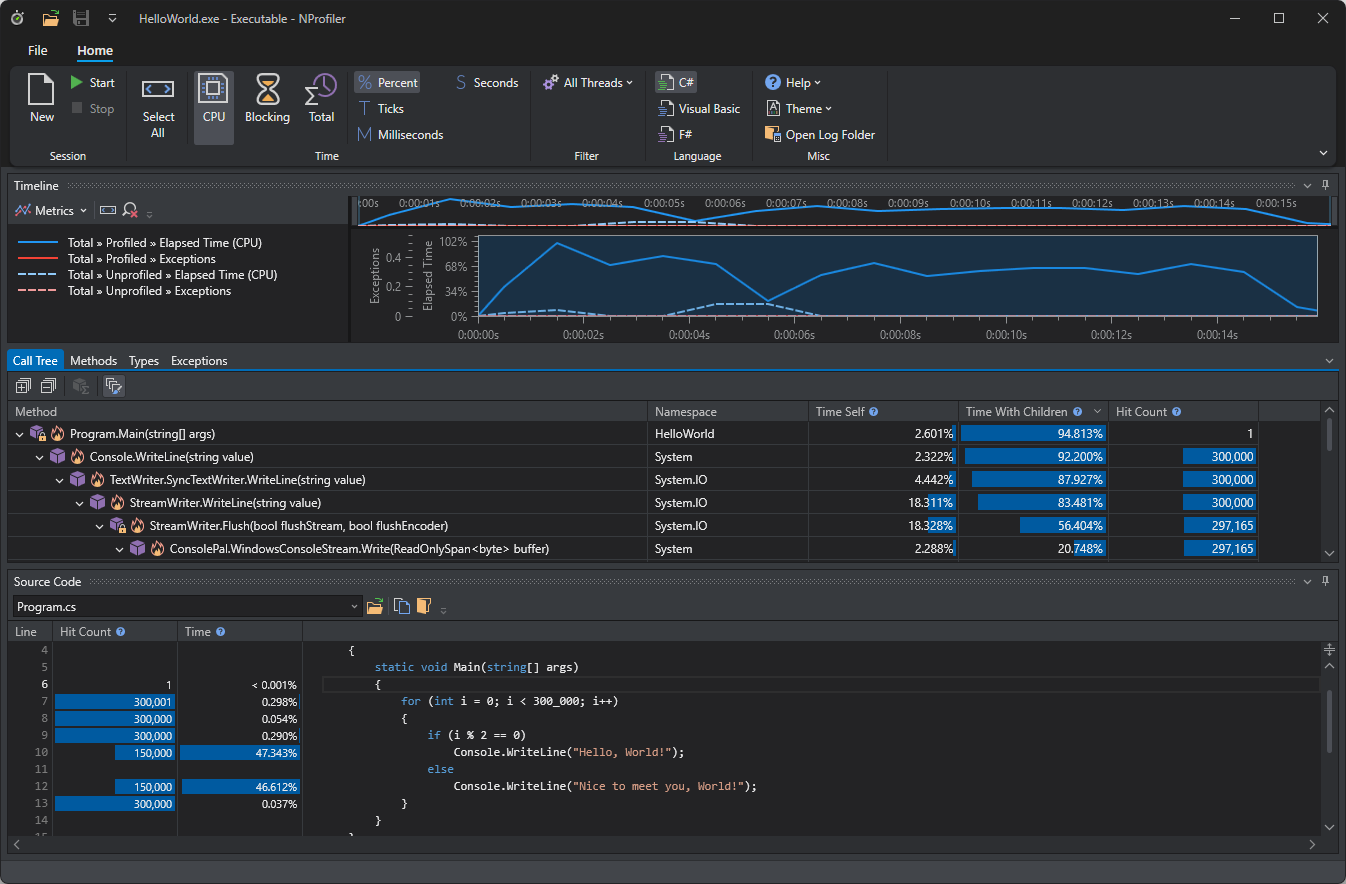
Highly accurate timings
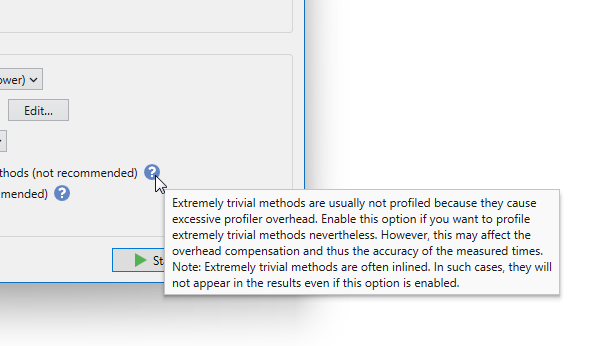
Overhead Compensation = Better Results
NProfiler is superior when it comes to accounting for profiler overhead to clean up measured timings.
- On average, NProfiler delivers significantly more accurate timing data than competing tools.
- By providing precise measurements, NProfiler eliminates the risk of wasting resources on "false bottlenecks".
- Observe your code’s true performance as if it were running in production—free from profiler-induced overhead.
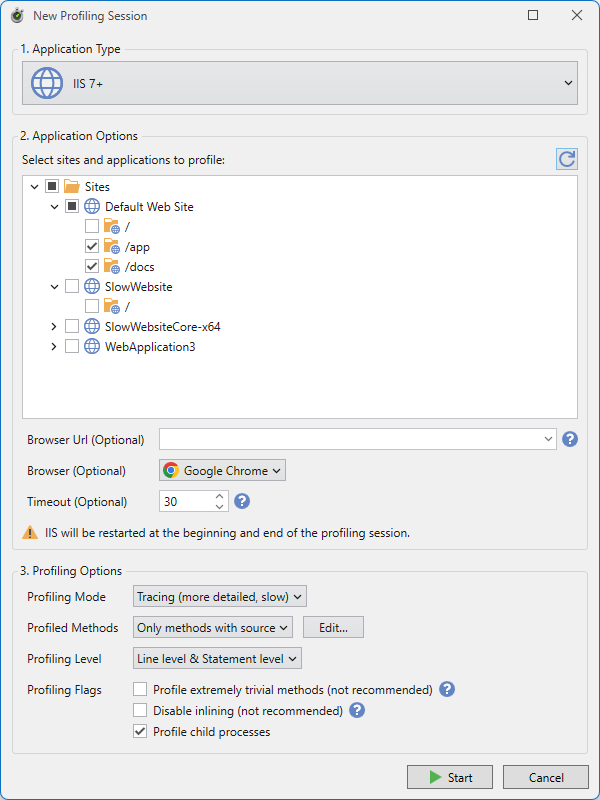
Profile any .NET application
Including .NET executables, ASP.NET web applications, Windows services, IIS and IIS Express sites and attach to running .NET processes.
In any .NET language with any framework
Profile C#, VB.NET, and F# using .NET Framework 2.0+, .NET Core, .NET 5+, and .NET Standard on Windows and Windows Server.
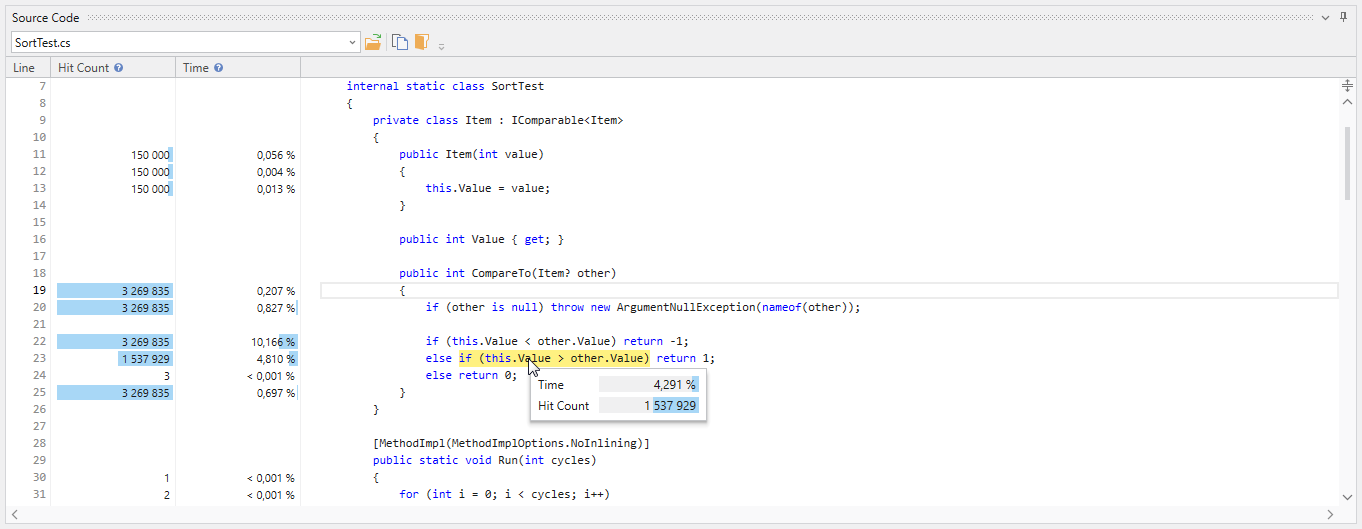
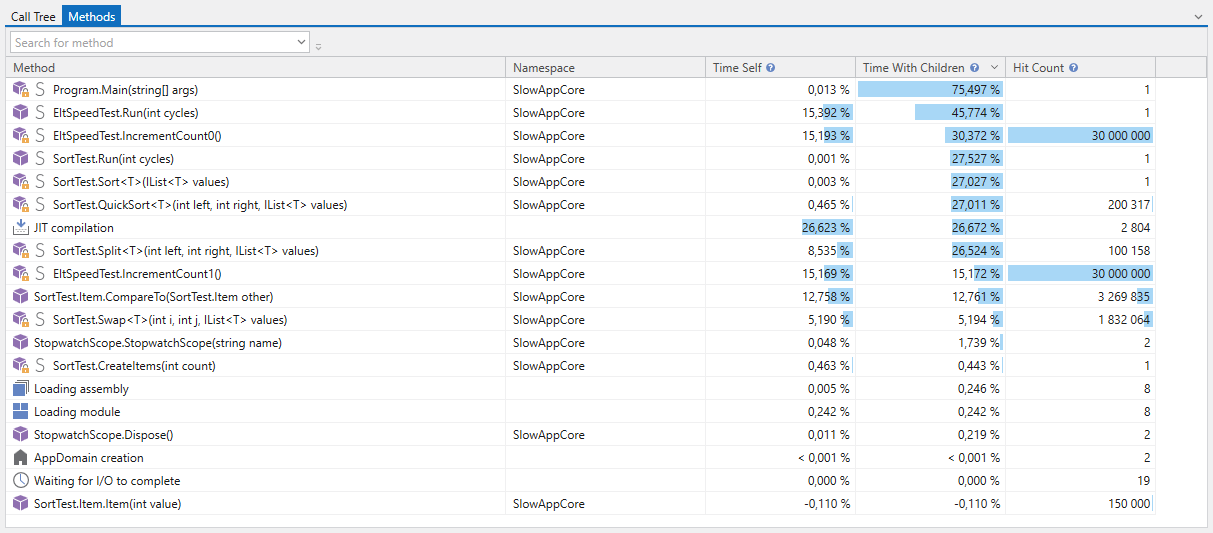
Integrated decompilation
Get line-level timings even if you don't have source code, for example, for third-party components or legacy assemblies.
Works seamlessly with .NET security
NProfiler uses clever tricks to provide line-by-line results even for security-transparent and partially-trusted assemblies, while other profilers simply crash.